How to profile a production Blazor client-side app ?
Performance optimization is one of the programming task that I prefer. It’s really rewarding and requires knowledge, practice, creativity … The first thing you need to learn when optimizing performance is that you should always profile before optimizing. And always, when possible, favor production profiling instead of developer or staging profiling. Why ? Well you optimize for your production environment and this environment has different CPU, disk, memory, OS … specification than the other environment. So If you want your work to be useful, you need to profile production environment. For server-side profiling, with a .net stack there are many tools :
- WinDBG
- MiniProfiler
- SQL Server Profiler
- Jetbrain dotTrace
- APM provider (like Azure AppInsight or Datadog)
- dotnet trace
- many more
Each of them has its role and if your team embrace DevOps values (“you build it, you ship it”) or you are just close to the operations then you should at least know them and know how to use them on your PRODUCTION environment. Let me insist one more time on this : optimizing without profiling production environment is nearly worthless. You can have result, but you can’t be sure about it, it will be only guessing. Given the fact that, most tof the time, optimizing makes your code harder to read : you prefer to do it only where it matters.
But you can’t deploy every try to see if it is efficient right ? For me the process is the following :
- Profile the production for finding on which code path you should work
- Profile on your workstation to see how long this code path takes on your environment
- Optimize on your workstation and profile after each optimization until this number is lower
- Deploy your change to production (if your tests passes)
- Profile the production and check if your optimization is truly efficient.
- If you had to make your code less readable and your optimization is not efficient in production, then rollback your change and go back to square 1.
But with Blazor we are working on the client-side, most of the tools I described can’t be used client-side (AFAIK) because they can’t be executed on your browser. In this blog post I will explain how you can profile a production Blazor WASM application.
I think this can also be used by Blazor server-side but the tools for profiling on the server are already enough.
Browser profiling tools
For this blog post I will use Google Chrome. Google Chrome provides a tools for profiling client-side code. To do so start of DevTools then :
- Tab “Performance”
- Click on the record button on the top left of the frame
- Execute the code you want to profile
- Click on the stop button
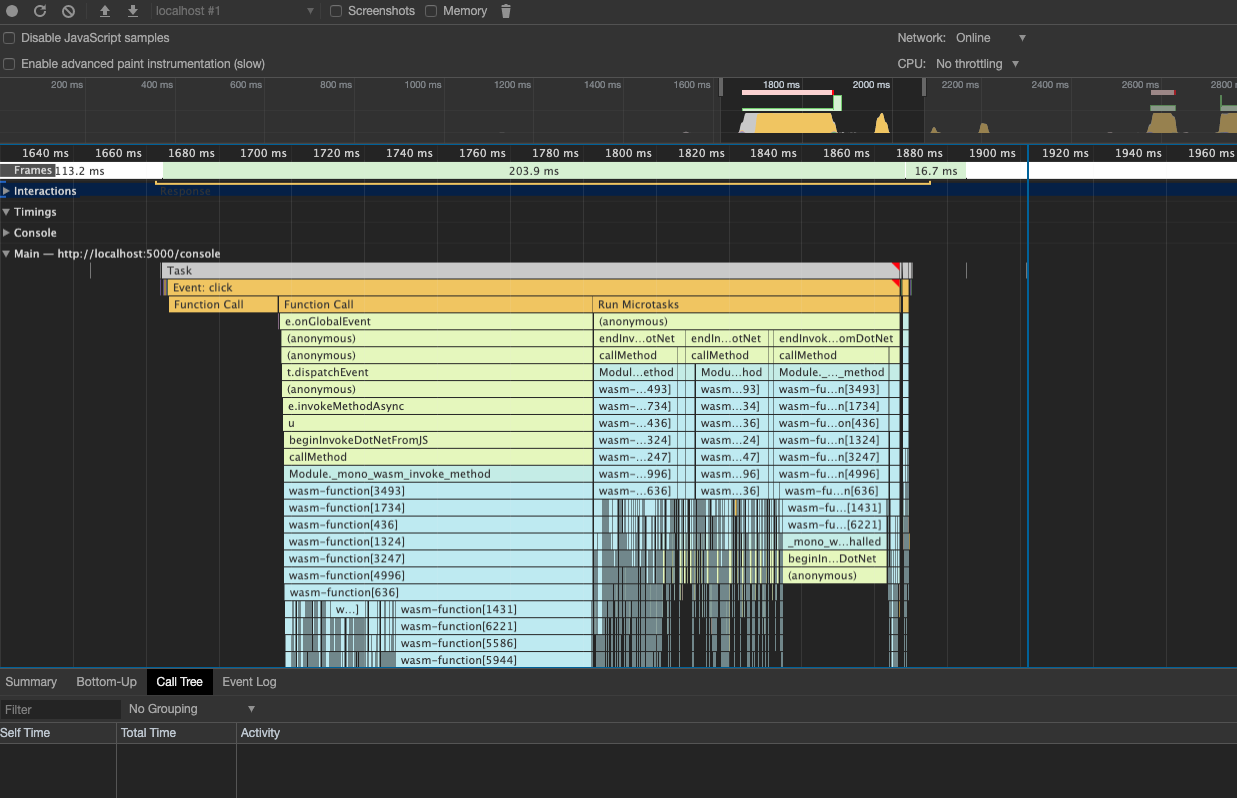
Then you will have something like that

I won’t describe you how to read everything in this profiling result (you can use this doc) but we can quickly understand the problem we faces with a Blazor WASM app : the executed .net code is behing a “wasm-function…” step and you can’t link it to your code. But there is already something interesting, you can see how much time the rendering (DOM update) is taking by searching for the method “renderBatch”.
Adding custom timings to profiling results
The good news is, there is some Javascript API for adding informations to the profiler result : console.time and console.timeEnd. You can call it like that
@inject IJSRuntime jsRuntime;
@code {
    //...
    public async Task Method(){
        try{
            await jsRuntime.InvokeVoidAsync("console.time", "sub task");
            await Task.Delay(100);//do something
        }
        finally{
            await jsRuntime.InvokeVoidAsync("console.timeEnd", "sub task");
        }
    }
    //...
}
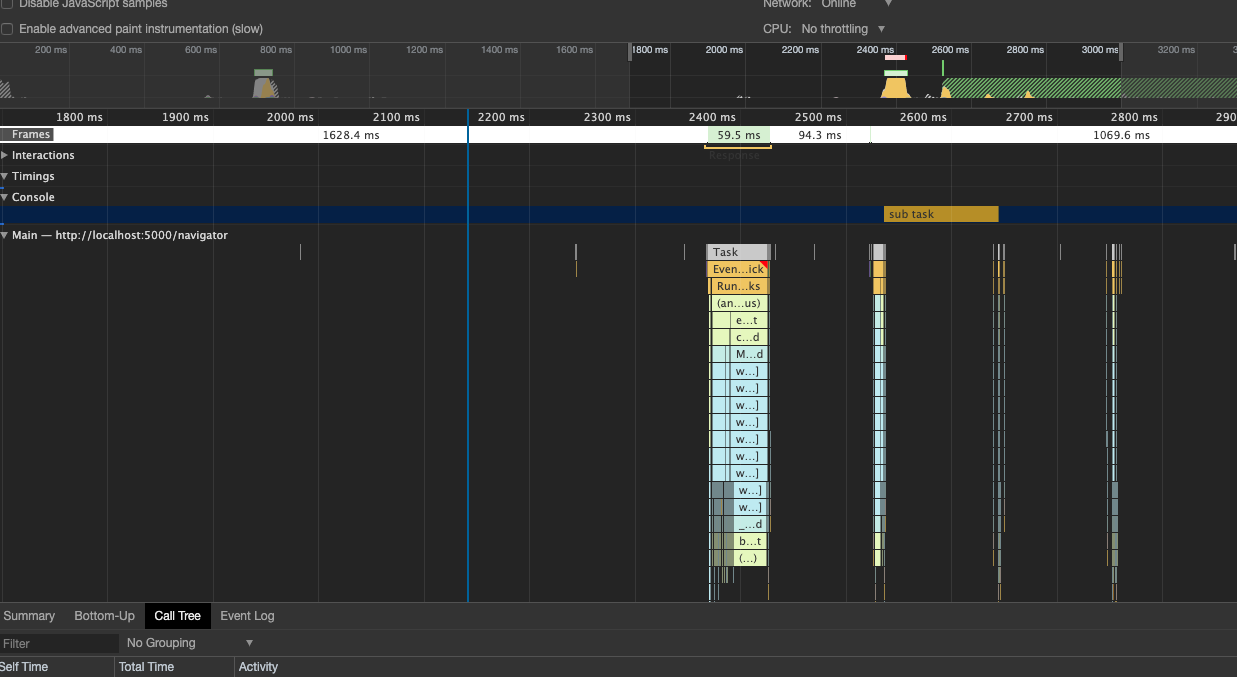
With this code, if you have a profiling session recording then the profiling result will display a line called “Console” which will display “sub task” in the profiling session. So you will be able to see how long it took for your code to run, how much CPU / Network / memory it used, how it relates to other profiled method call… :

We can see the “sub task” label is displayed on the profiling results. If I create multiple label then I can easily identify which code is taking a long time to run.
Overhead
When you are profiling, the host is executing more stuff. So there is always an overhead in your profiling, always. Does it matter ? Yes and No :
- Yes : because if you add profling code in your production code, you don’t want it to slow down the production.
- No : you don’t care if a function takes 100ms or 110ms when profling, you just want this number to go down.
If I look at the profiling session I did on the previous paragraph, I can see that my method took 109.32ms instead of the 100ms expected. Why is that ? There is multiple potential culprit of this
- JS interop
- “await” overhead in mono-wasm
- task.Delay is not precise
If I increase the Task.Delay to 200ms then the overhead is constant (+9,9ms) which seems normal because we are not doing CPU profiling. The overhead is not really a problem because the point is to treduce this number, the number itself is not very relevant. It can be relevant in some case, let’s say you have a spec like this “you need to have this done under 100ms” then you will have to take into account the overhead during your optimization work.
I did an other test and commented out the Task.Delay then the step is only 1,5ms, so in the profiling above we can say that 1.5ms are because of the interop call and 7.5ms are because of Task.Delay (which I think involves many jsinterop roundtrip).
The problem with this overhead (even if it’s low, we don’t know on which computer our user will run the code) is that you can’t keep this code in production because it would make performance worst in production. So you should put a flag before the profiling code and enable / disable it with an easter egg or something like that :
@inject IJSRuntime jsRuntime;
@code {
    private bool IsEnabled = false;
    //...
    public async Task Method(){
        try{
            if(IsEnabled)
                await jsRuntime.InvokeVoidAsync("console.time", "sub task");
            await Task.Delay(100);//do something
        }
        finally{
            if(IsEnabled)
                await jsRuntime.InvokeVoidAsync("console.timeEnd", "sub task");
        }
    }
    //...
}
- There is still the overhead of the larger downloaded code and “if” evaluation but this is not relevant
- This code is highly repetitive and should be refactored
The BrowserInterop package
At first I wanted to create a sub project in MiniProfiler but I got some problem with Blazor and MiniProfiler. Then I found out about the browser API and I thougght about creating a package that would wrap all the browser APIs and make them easier to use by a C# developer :
- Use IDisposable like MiniProfiler
- Use better typing when I can (enum, timespan, datetime …)
- Create helper for handling case not handled by builtin library like event handling or JS variable reference.
So I created the package BrowserInterop you can install it with this command
dotnet add package BrowserInterop
Then use it like that
@inject IJSRuntime jsRuntime;
@using BrowserInterop ;
@code {
    private bool IsEnabled = false;
    //...
    public async Task Method(){
        var window = await jsRuntime.Window();
        await using(await window.Console.Time("sub task"))
        {
            await Task.Delay(200);
        }
    }
    //...
}
Wrapping the code in a using statement makes it easier to read. And because I refactored the interop call, I was able to provide a way for disabling it easily like that
ConsoleInterop.IsEnabled = true;
With this value set to false, all calls to any method inside window.Console will be ignored. With a well placed easter egg (hidden button or double click on the header) you can enable or disable this in production.
For now this package provides all the method in window.console and many method and fields in window.navigator and window. You can find out more on the project repository here https://github.com/RemiBou/BrowserInterop. I will publish the package v1 once I’m done with the window API (alert, frames, performance …). Do not hesitate to try and and send me feedback on the repo, here, on twitter, by mail or anything.
Conclusion
Being able to profile live app is a real advantage and the only way for getting valuable results. Do not forget to profile your app on different computer / Browser / OS as most of the time you have no impact on those. I hope my solution and my package will help you.